Work Samples
Exhibits
Data Privacy & Confidentiality Notice: To protect client confidentiality, all exhibits and sample deliverables utilize scrambled, scaled, and fully anonymized data frameworks. Figures have been mathematically altered by varying magnitudes to ensure zero correlation with any true company financials. These materials are presented strictly as conceptual methodologies and structural examples of our work.
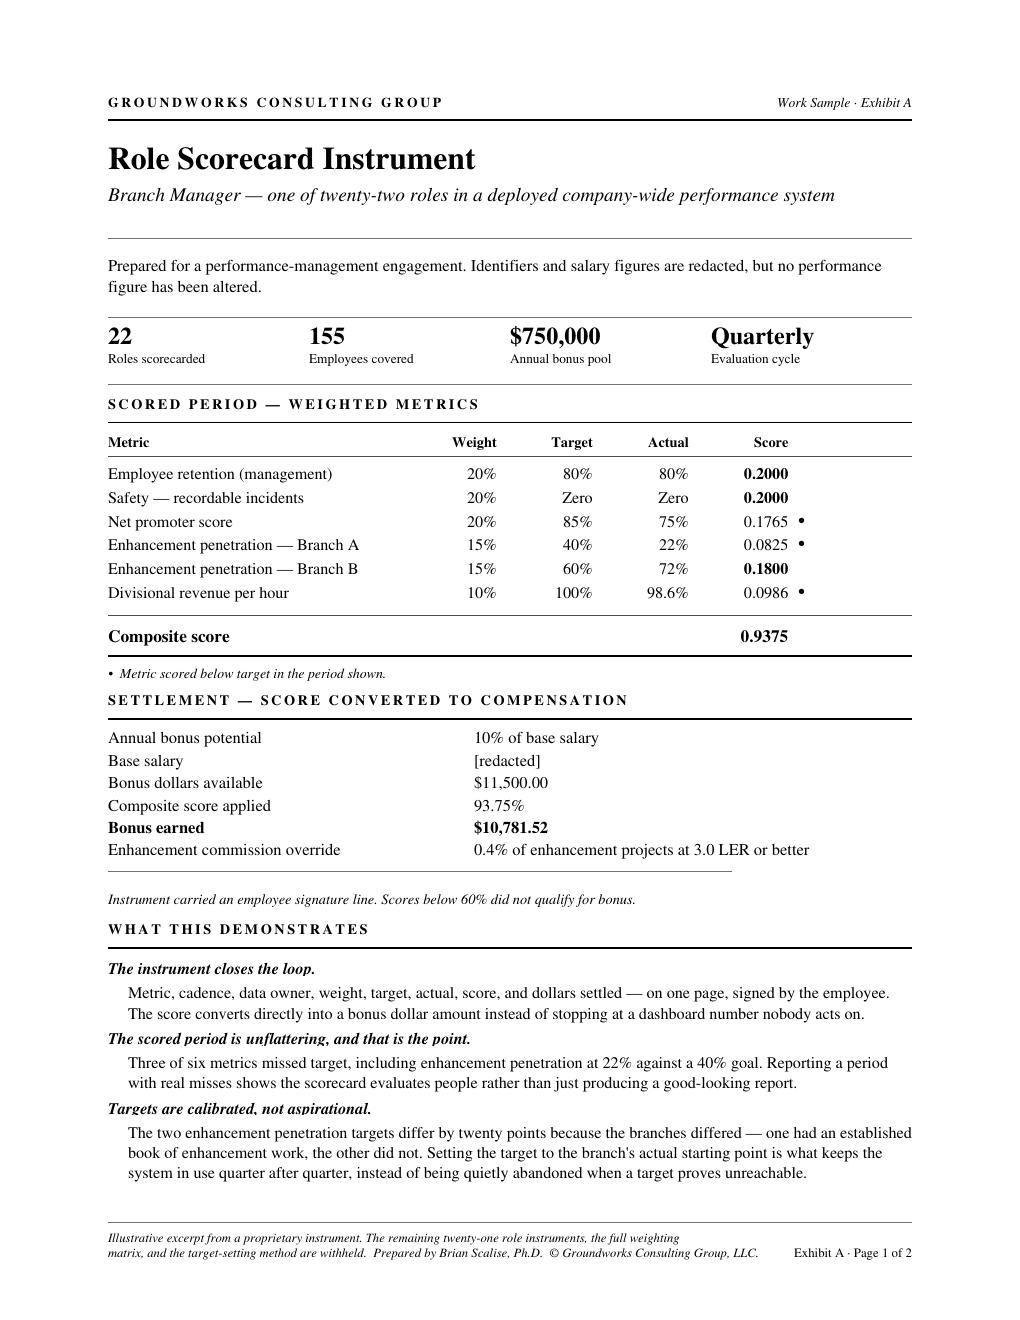
Exhibit A · Performance Management
Role Scorecard Instrument
22 roles · 155+ employees · $750K pool · six divisions. Quarterly production metrics replace annual review subjectivity.
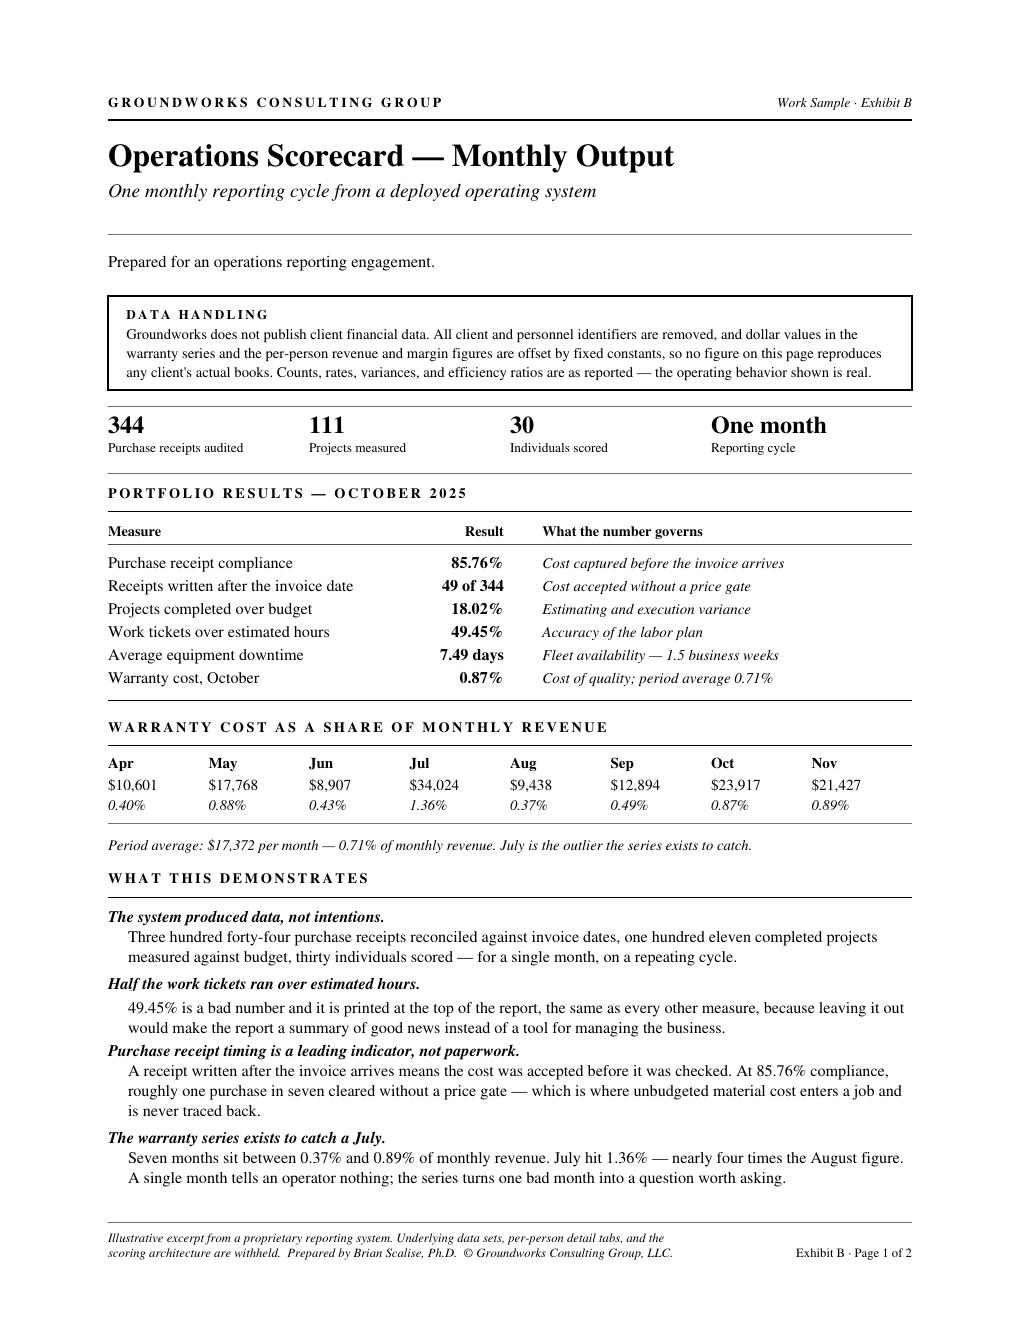
Exhibit B · Operations Reporting
Operations Scorecard Monthly Output
344 purchase receipts audited · 111 projects measured · 30 employees scored. One-page monthly output from a live reporting system.
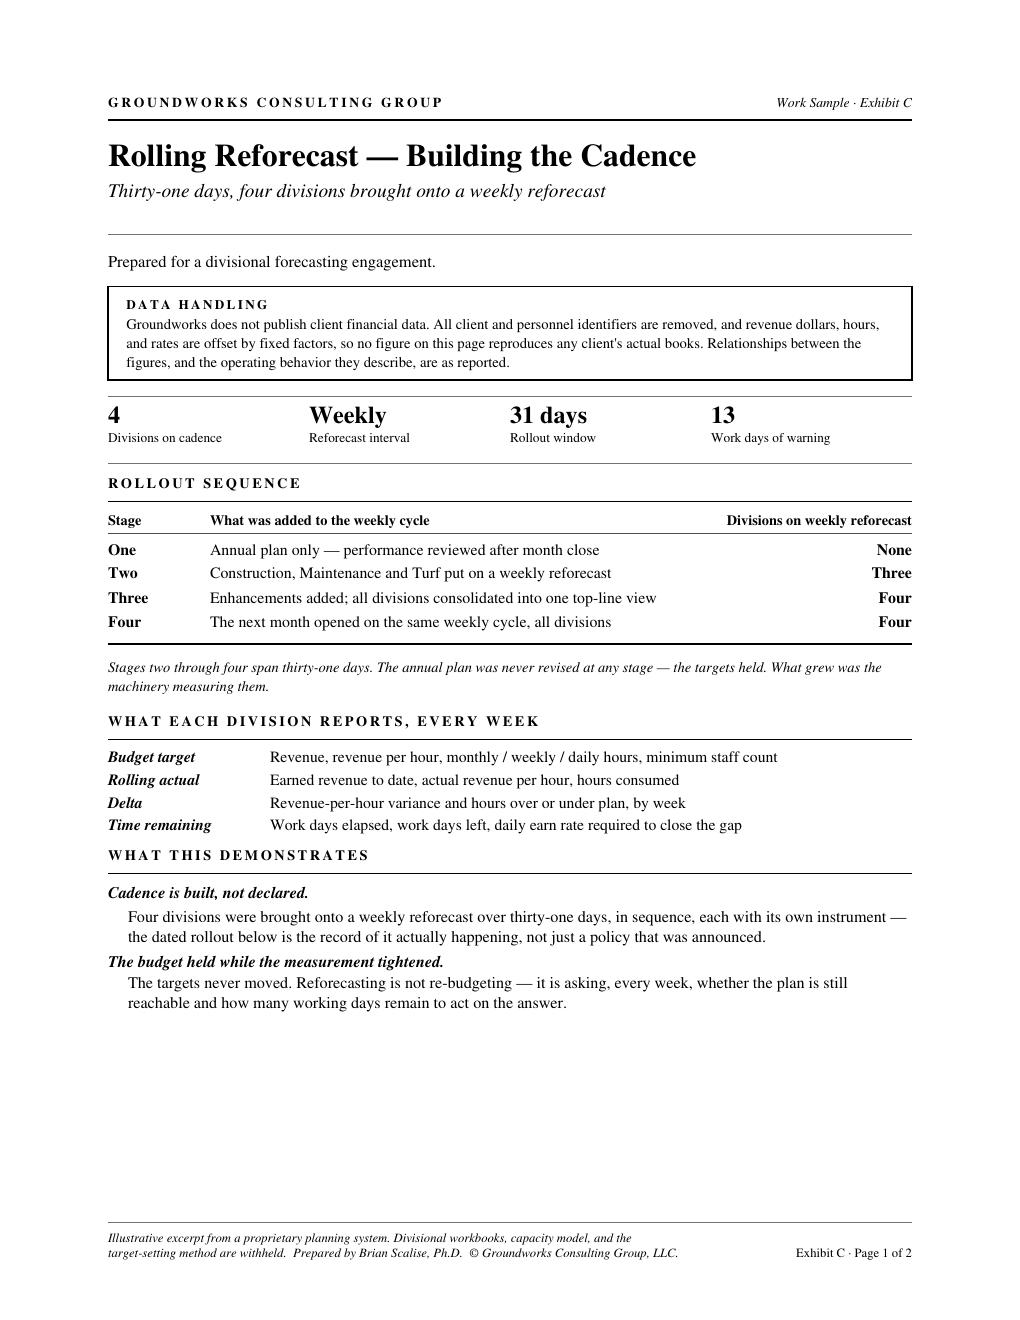
Exhibit C · Divisional Forecasting
Rolling Reforecast
Four divisions on weekly cadence in 31 days. The February construction catch: week-2 signal, 13 work days left, month closed at 53.7% of target.
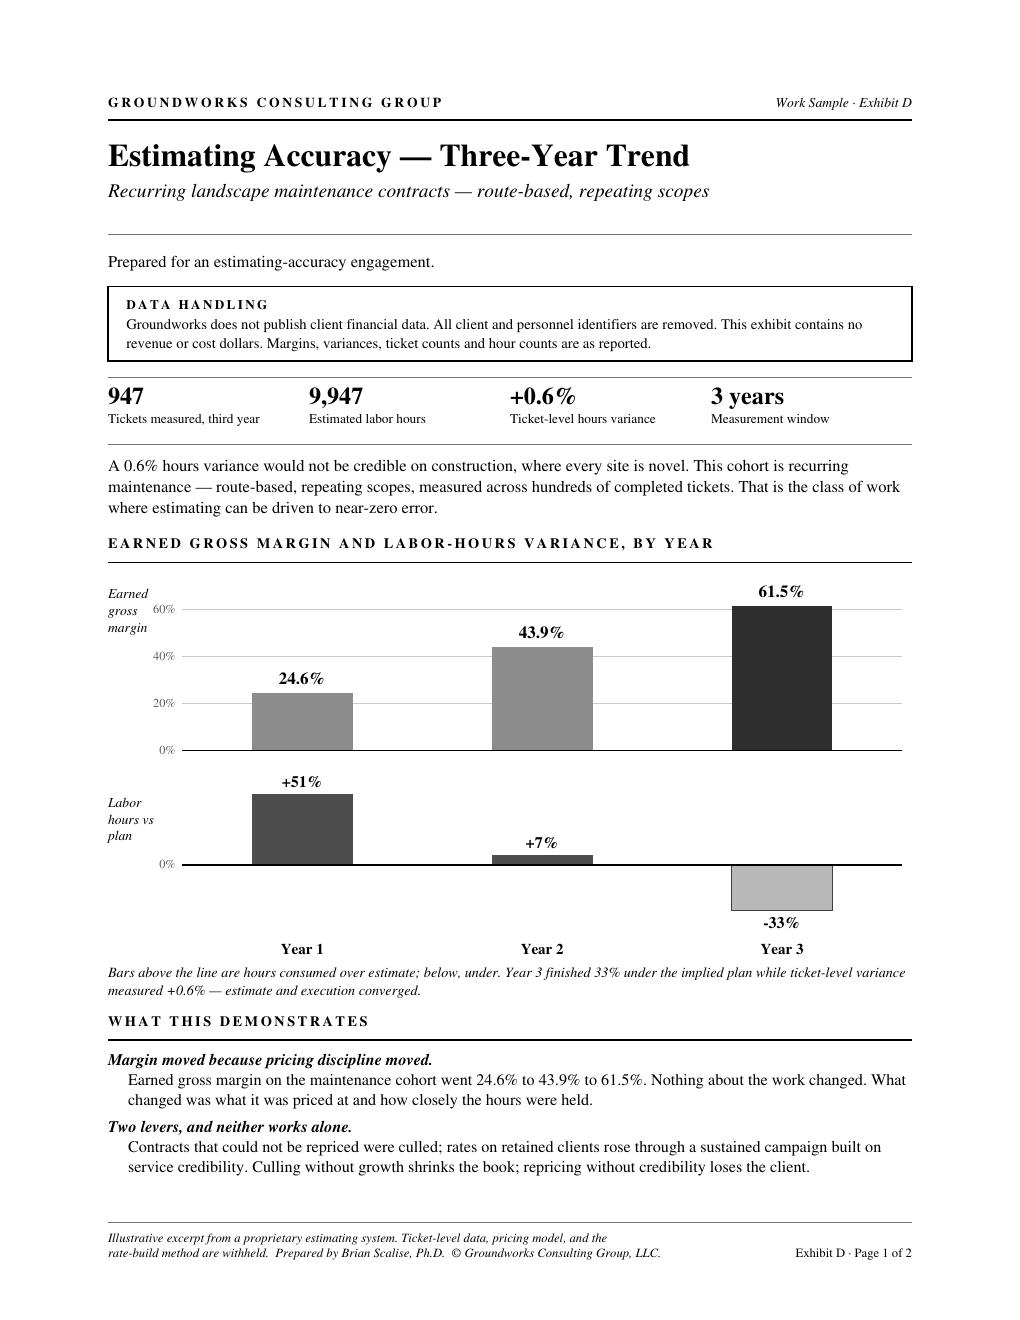
Exhibit D · Estimating Accuracy
Estimating Accuracy Three-Year Trend
Earned GM 24.6% → 43.9% → 61.5% on 947 route-based maintenance tickets. +0.6% hours variance across 9,947 estimated hours.
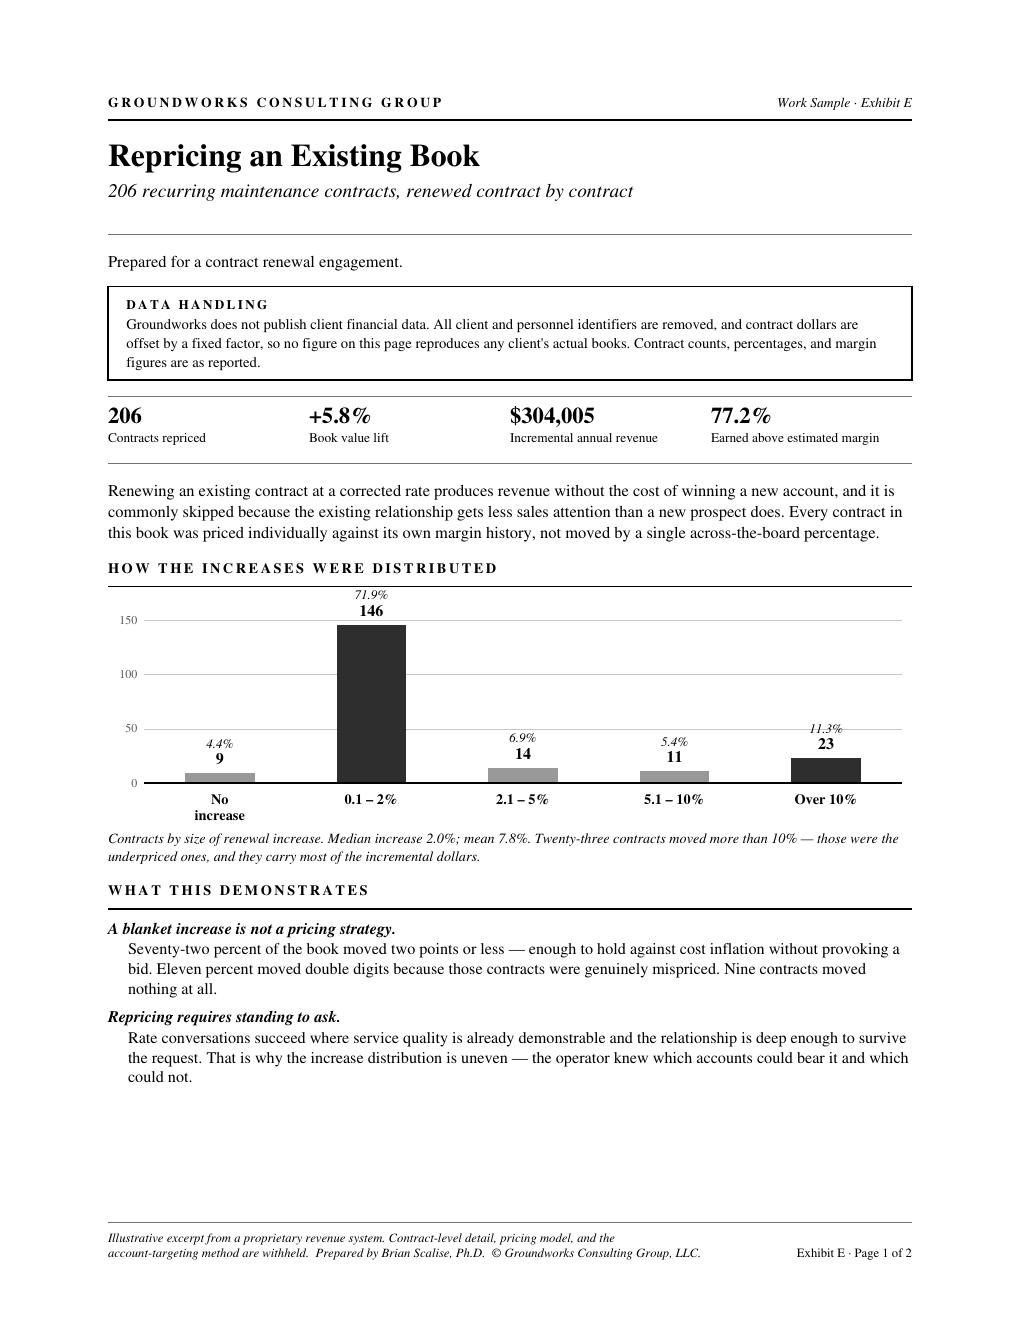
Exhibit E · Contract Renewal
Repricing an Existing Book
206 contracts · +5.83% blended lift · $304K incremental annualized. 77.2% of contracts earned above estimated gross margin.
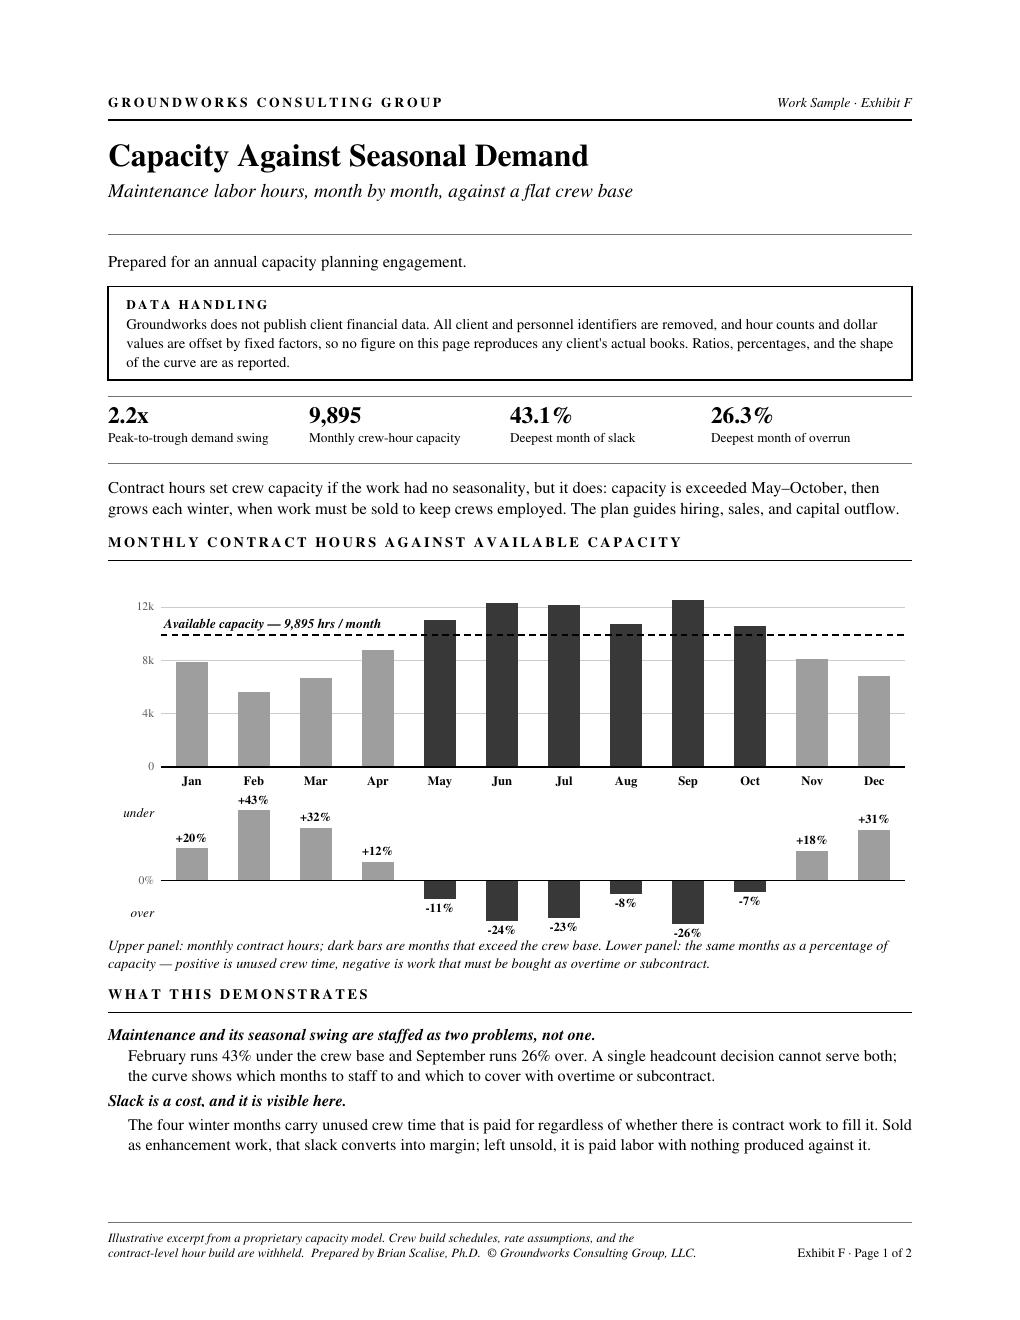
Exhibit F · Capacity Planning
Capacity Against Seasonal Demand
2.2x peak-to-trough swing across twelve months. Crew sizing decisions made from the chart, not from feel.
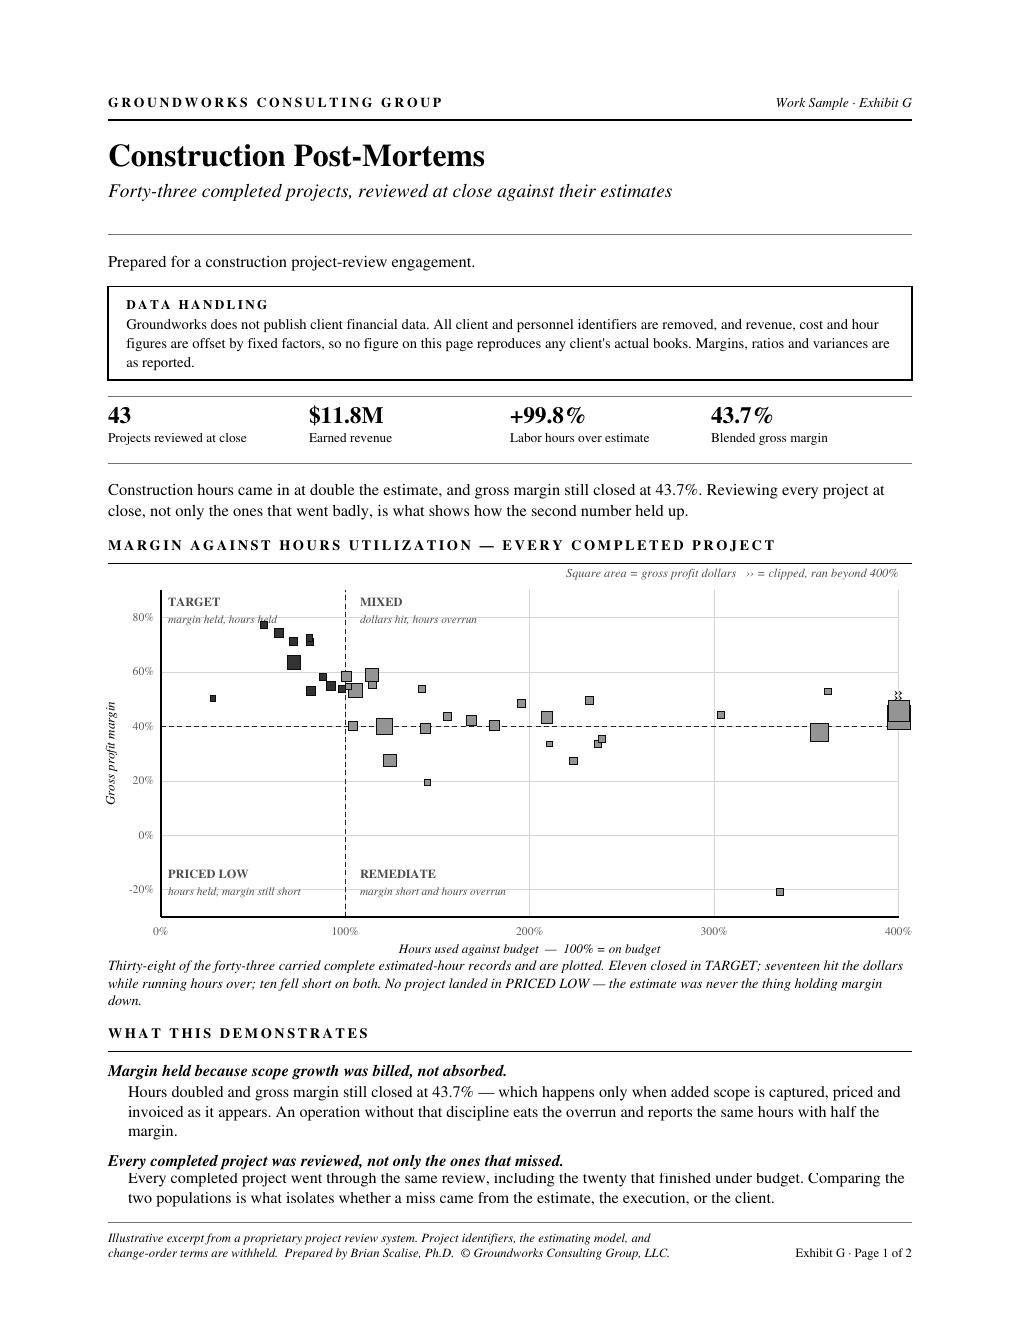
Exhibit G · Construction Review
Construction Post-Mortems
43 projects · +99.8% hours over estimate · 43.7% blended gross margin. Hours doubled; margin held. Quadrant scatter across every completed project.
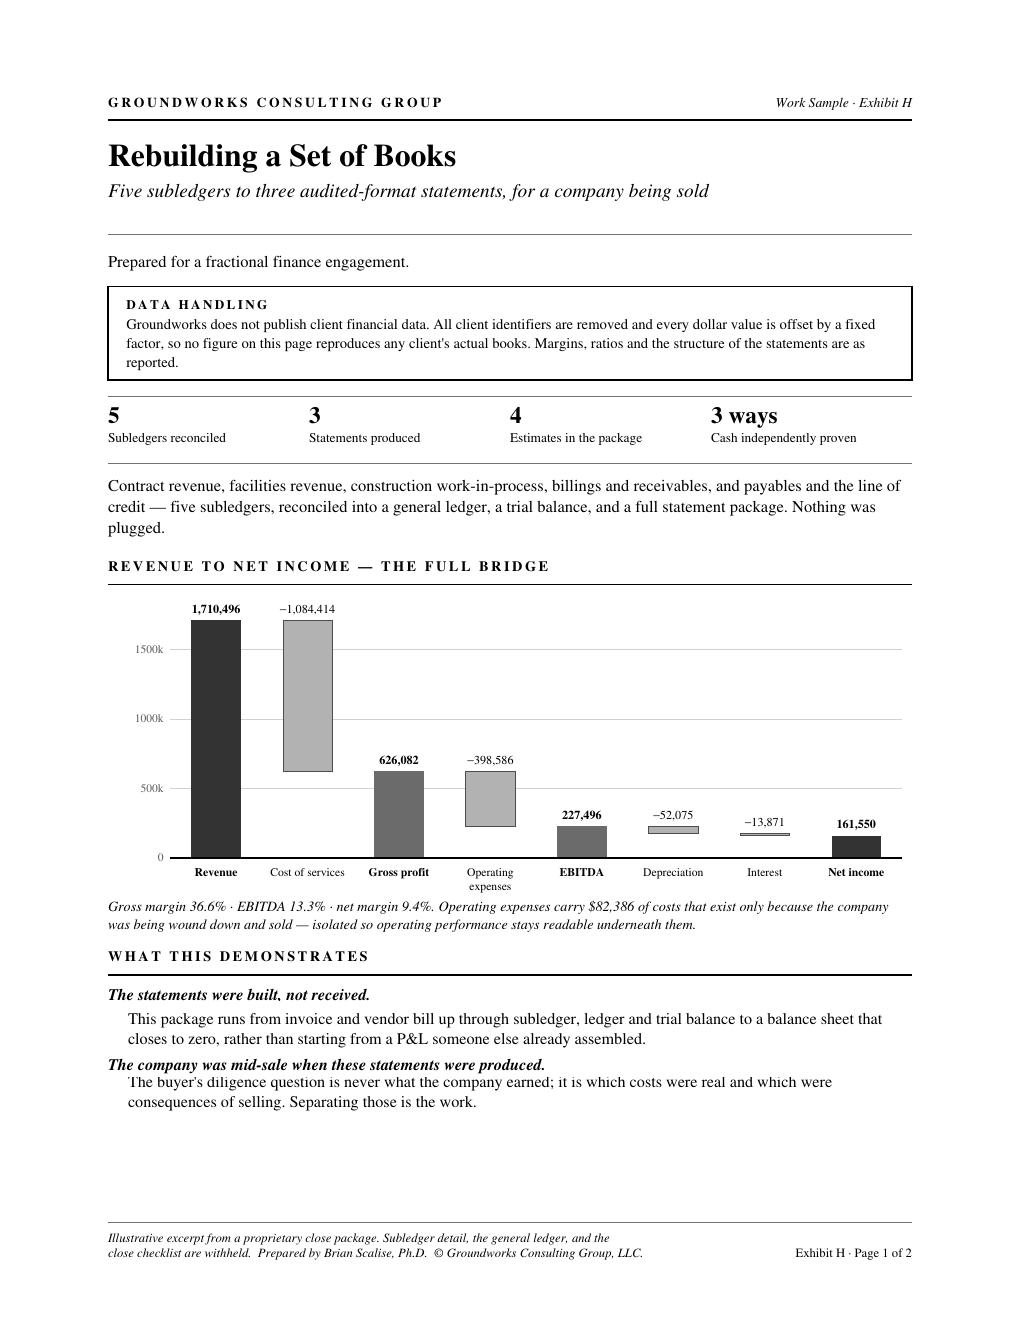
Exhibit H · Fractional Finance
Rebuilding a Set of Books
Five subledgers to three audited-format statements for a company being sold. Cash proven three independent ways; balance sheet closes to zero.
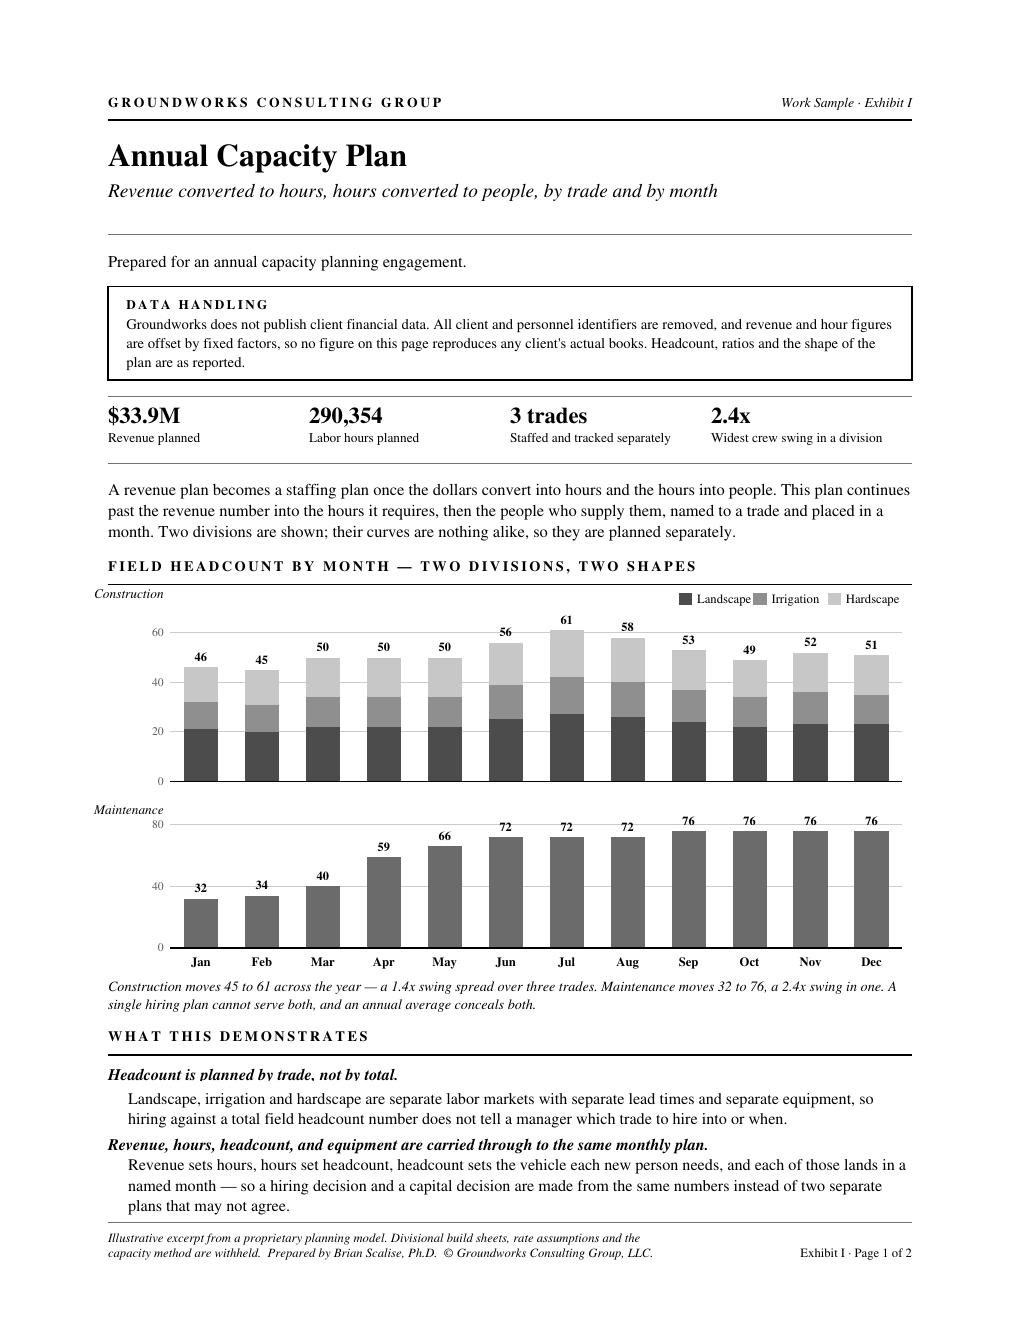
Exhibit I · Annual Capacity Planning
Annual Capacity Plan
$33.9M revenue · 290,354 labor hours · 3 trades staffed separately · 2.4x widest crew swing in a division. Revenue sets hours; hours set headcount.
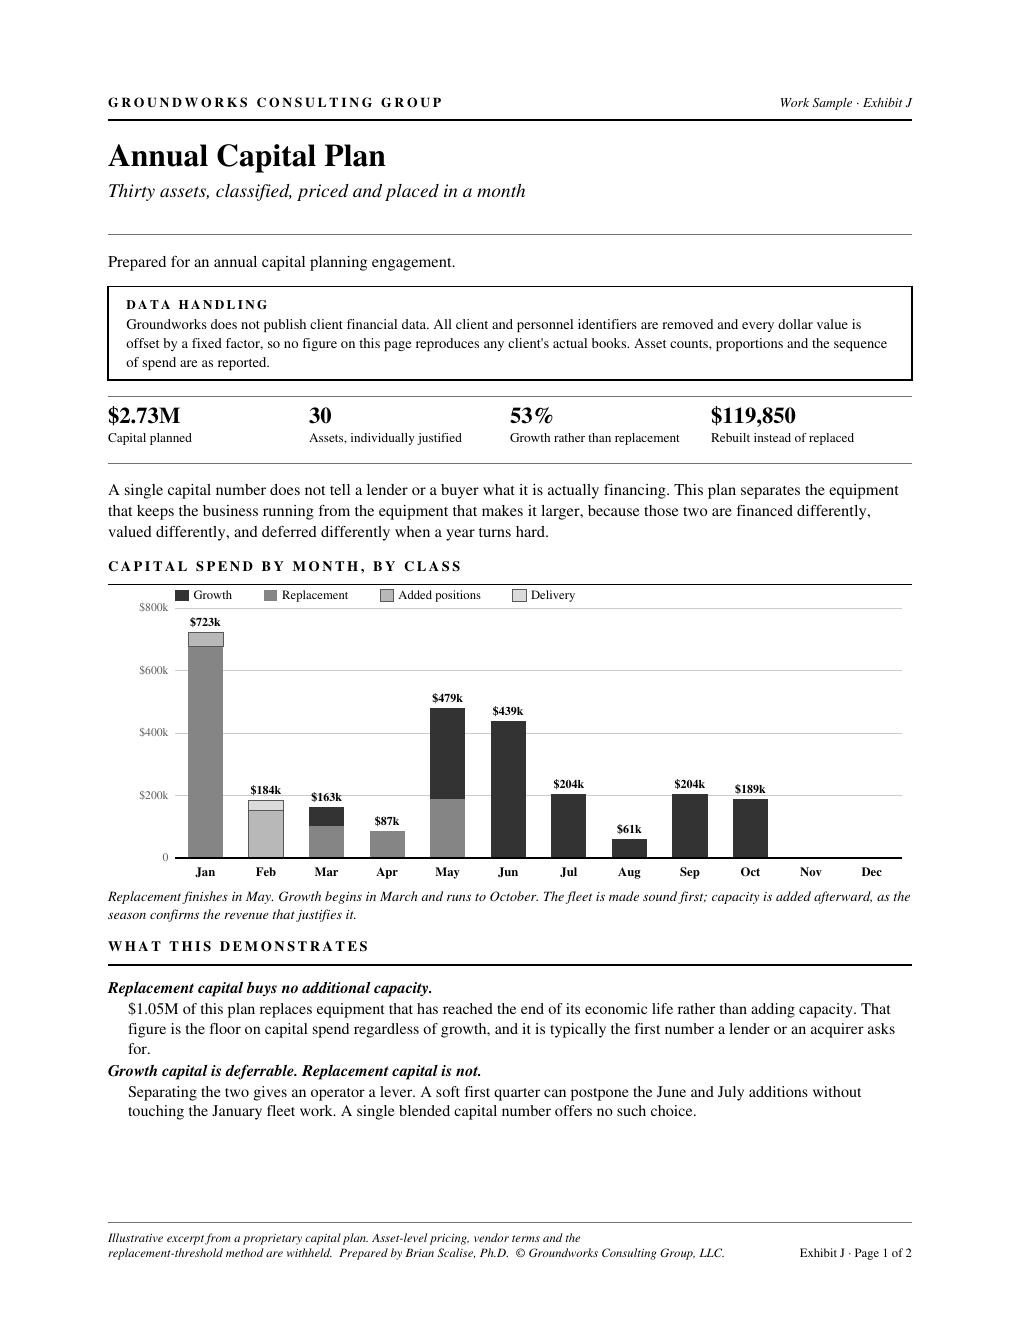
Exhibit J · Annual Capital Planning
Annual Capital Plan
$2.73M · 30 assets individually justified · 53% growth capital · $119,850 rebuilt instead of replaced. Replacement capital is not deferrable.
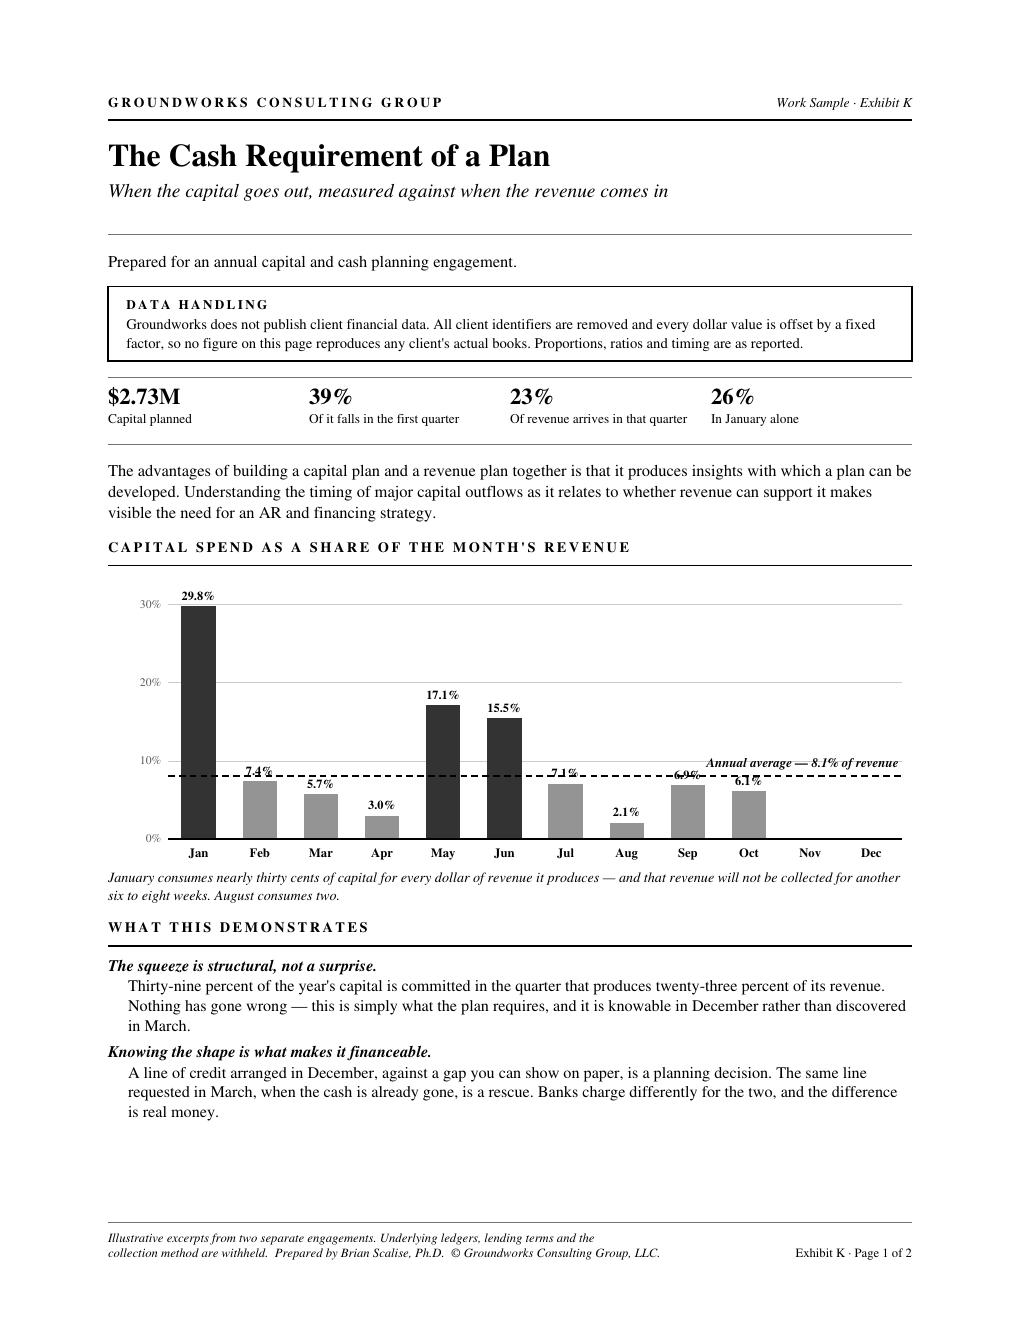
Exhibit K · Cash & Working Capital
The Cash Requirement of a Plan
39% of capital falls in the quarter that produces 23% of revenue. January alone carries 26%. DSO 51.8 vs DPO 37.3 days — a 14.5-day structural gap, peaking at 35.
The weight matrices, calibration rationale, and working models behind each exhibit are withheld from all client-facing materials. That is the engagement.